Data Center Load Growth: What It Means for the Power Grid
For almost fifteen years, electricity demand in the United States barely moved. Utilities planned around flat load, efficiency gains roughly canceled out new consumption, and a grid planner could assume next year looked a lot like this one. That era is over, and the reason is sitting in giant windowless buildings full of servers. Data center load growth, supercharged by artificial intelligence, has become the single biggest swing factor in grid planning, and it is arriving faster than the power system is used to moving.
This post works through the real numbers behind the surge, sizes up what a large campus actually demands from the grid, and explains why the most interesting fix is not more generation but making these loads flexible.
Why data center load growth is suddenly the grid's biggest story
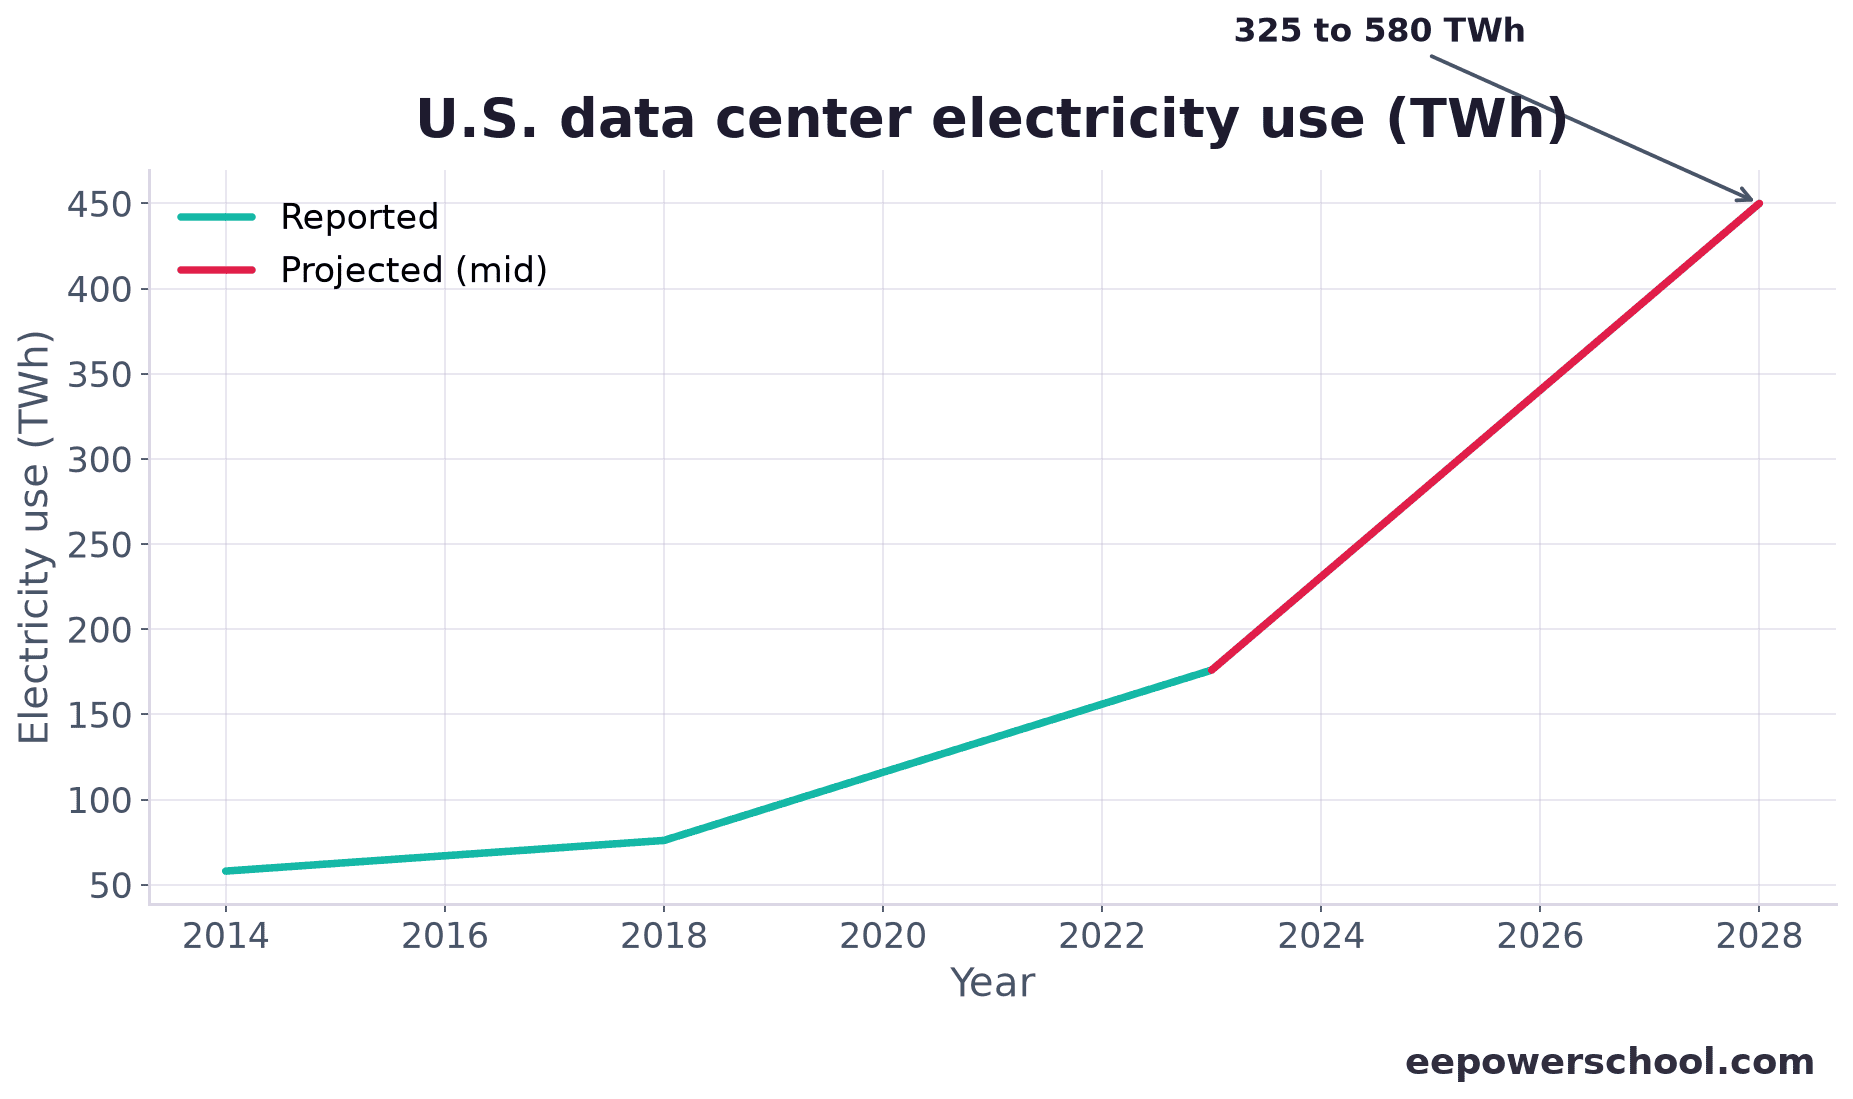
The scale is what makes this different from past demand stories. According to the Lawrence Berkeley National Laboratory report published for the US Department of Energy, data centers used about 4.4% of all US electricity in 2023, roughly 176 TWh, and that share could reach 6.7% to 12% by 2028 (see the DOE summary of the LBNL report). The annual energy climbed from 58 TWh in 2014 to 176 TWh in 2023, and the growth rate jumped from about 7% per year before 2018 to roughly 18% per year after it.
The picture is the same globally. The International Energy Agency puts data centers at about 1.5% of world electricity in 2024 (around 415 TWh) and expects that to more than double to roughly 945 TWh by 2030, with AI as the main driver. EPRI’s scenarios are even more aggressive for the US, projecting that data centers could consume 9% to 17% of national electricity by 2030, up from 4% to 5% today. In concentrated hubs the local picture is extreme: in Virginia, data centers already take about a quarter of the state’s electricity and could pass half by 2030.
Put those together and the message is clear. Data center load growth is not a rounding error on the demand forecast anymore, it is the forecast.
What makes AI loads different from ordinary demand
A new factory or a new suburb adds load too, so why do data centers get special attention? Four features set them apart.
They are huge and concentrated. A single modern campus is often 100 MW to several hundred MW, and gigawatt-scale sites are now being announced. That is the size of a small city landing at one substation, frequently in a rural area chosen for cheap land rather than grid capacity.
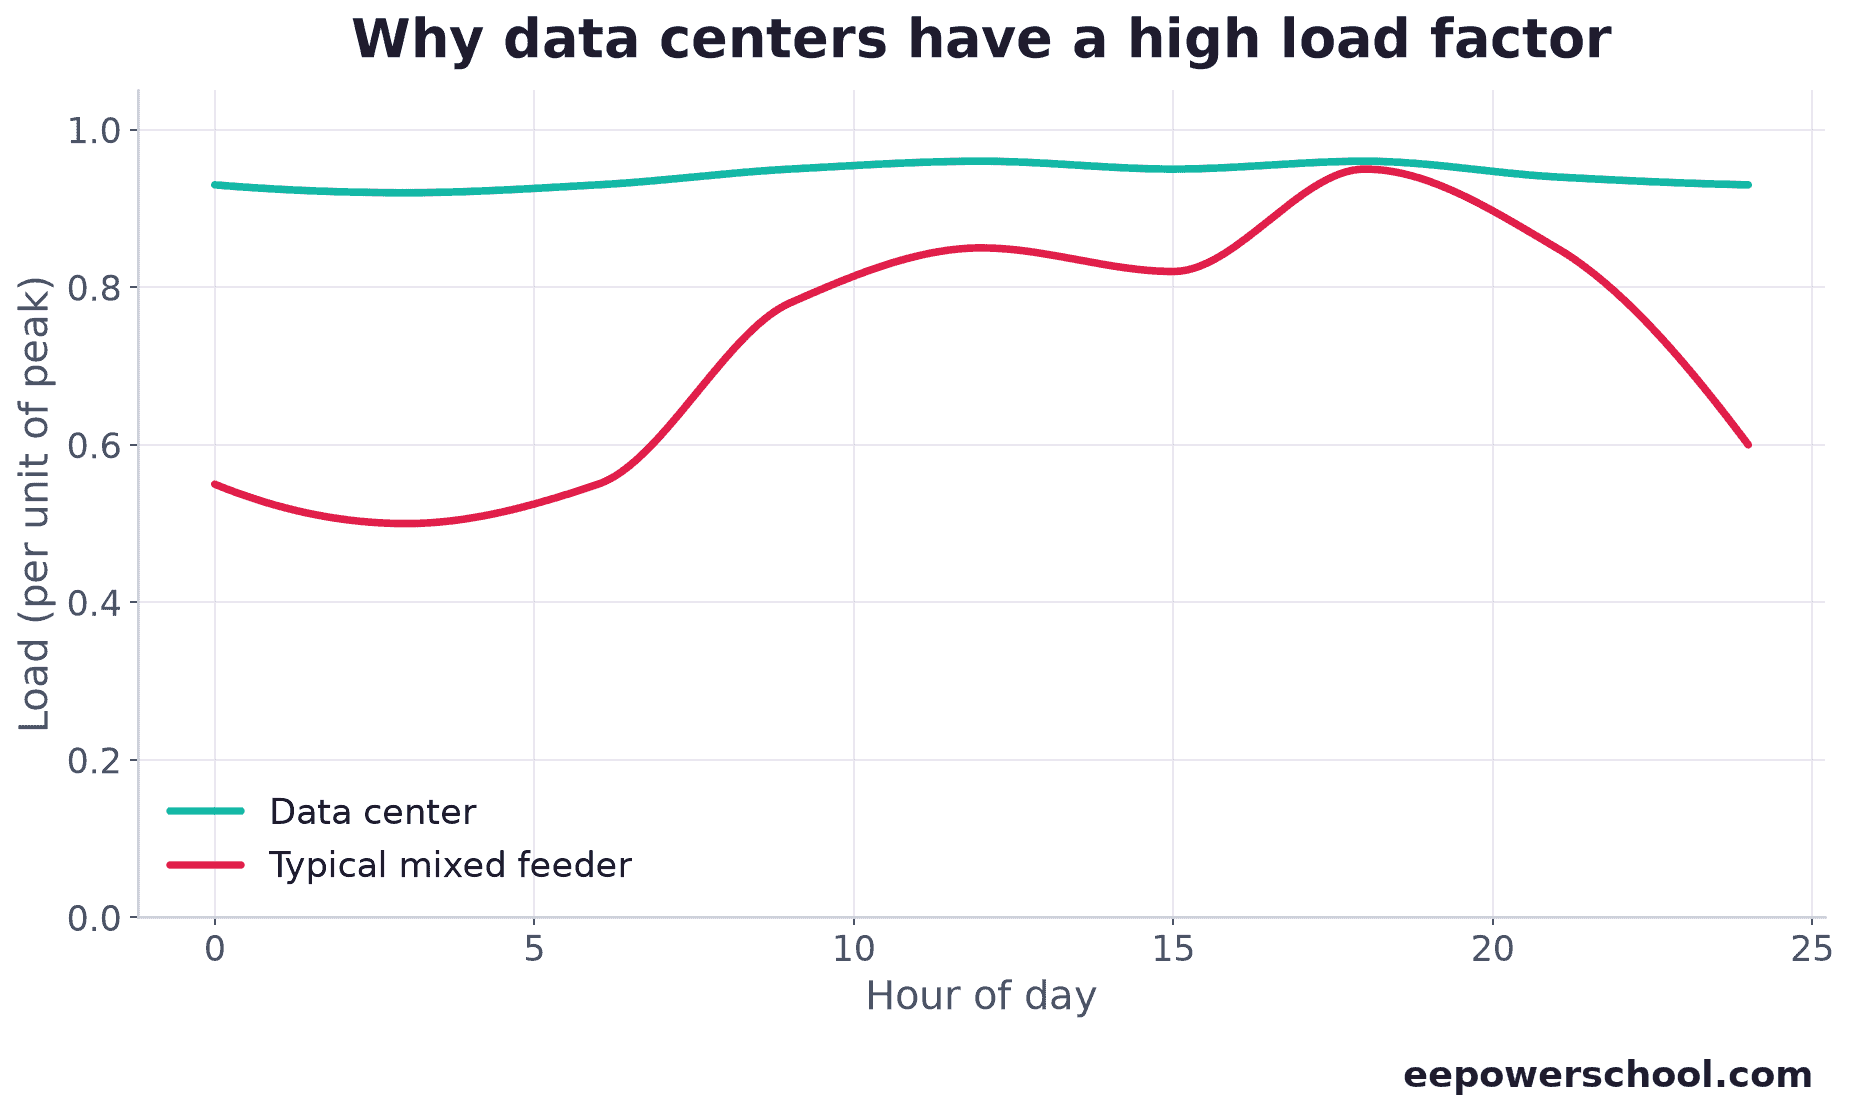
They run nearly flat. Unlike a city, a data center draws close to its peak around the clock. That high load factor (often 0.85 to 0.95) means it adds firm energy and firm peak together, which is far harder to serve than a peaky load of the same size.
AI training loads swing fast. Thousands of GPUs working on the same training job ramp up and down almost in unison, so a site can move tens of megawatts in seconds when a job starts, pauses, or checkpoints. Those synchronized steps are a real power quality and balancing headache that ordinary loads never create.
They are firm and, by default, inflexible. Operators want close to 100% uptime, so the starting assumption is that the load cannot be interrupted. As we will see, that assumption is exactly what needs to change.
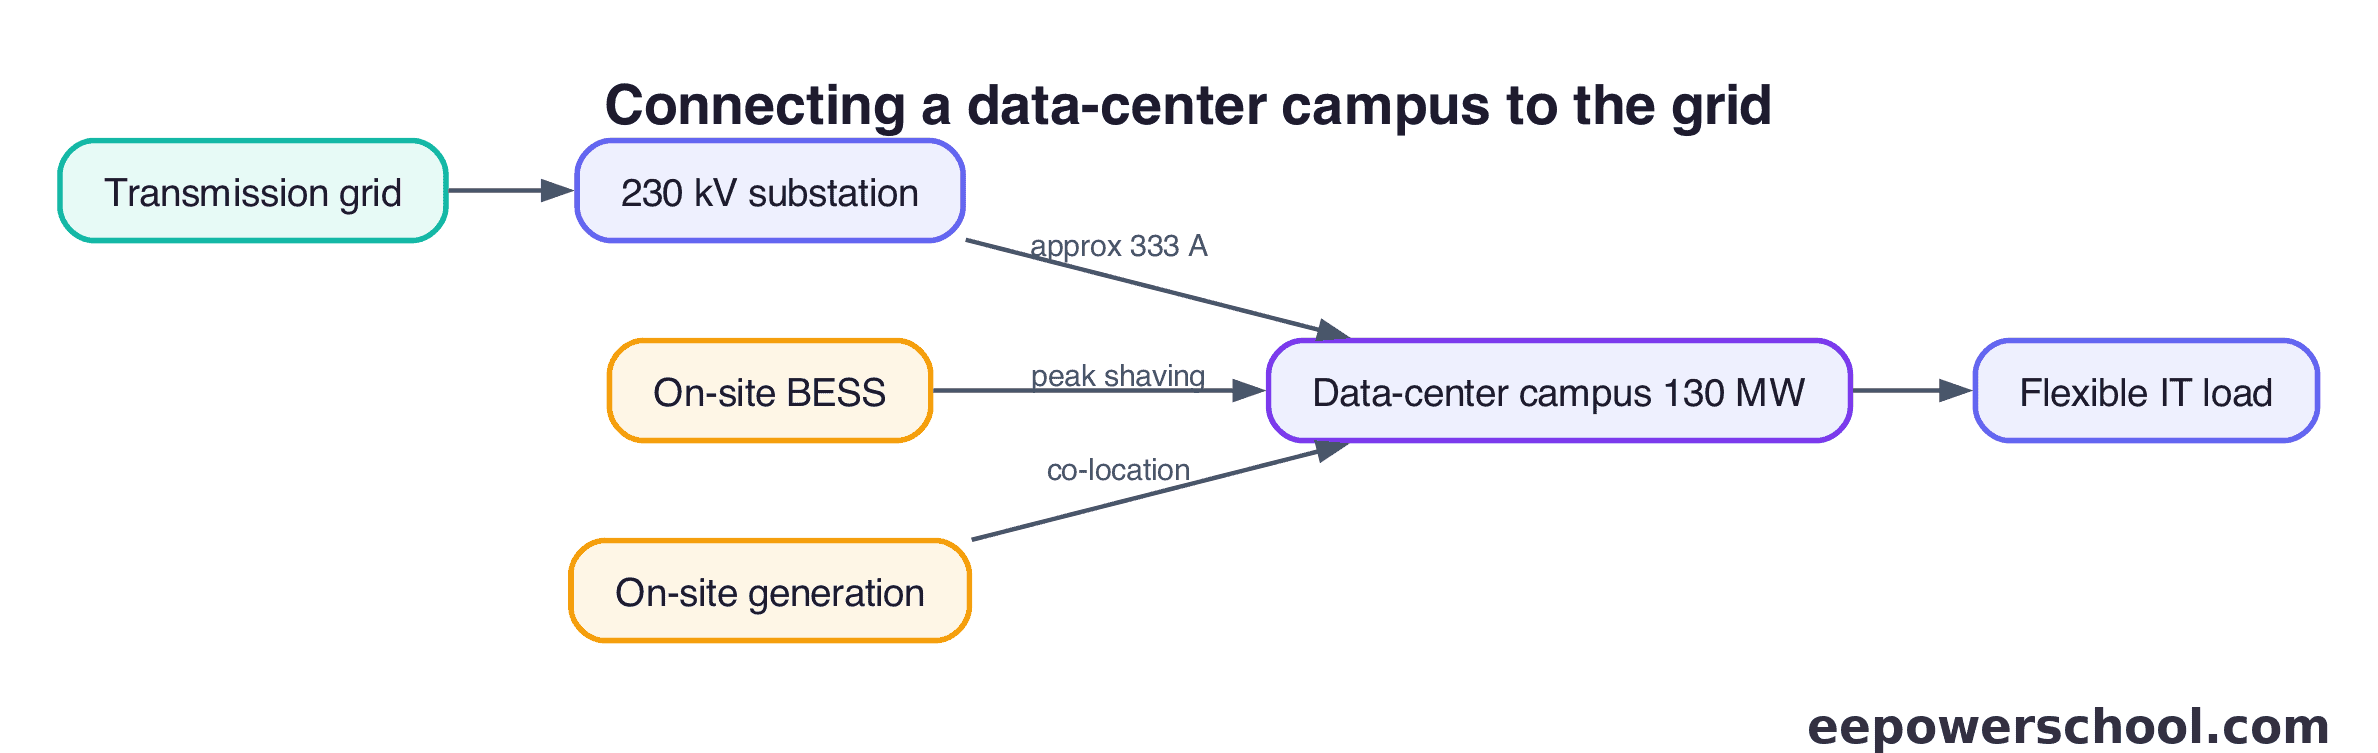
Worked example: connecting a 100 MW data center campus
Let us put numbers on it. Take a campus with 100 MW of IT load (the servers themselves). The total draw at the meter is larger because of cooling, power conversion, and lighting. That overhead is captured by Power Usage Effectiveness (PUE), the ratio of total facility energy to IT energy. A modern hyperscale site runs around PUE 1.2 to 1.3, so:
\[ P_{\text{facility}} = P_{\text{IT}} \times \text{PUE} = 100 \times 1.3 = 130\ \text{MW} \]
Now the annual energy. Because the campus runs nearly flat, take a load factor of 0.9:
\[ E_{\text{year}} = P_{\text{facility}} \times 8760 \times \text{LF} = 130 \times 8760 \times 0.9 \approx 1.02\ \text{TWh} \]
That is about 1,025 GWh per year, close to the annual consumption of 100,000 average US homes, from one campus. For the grid connection itself, at a point-of-connection voltage of 230 kV and a power factor of 0.98, the line current is:
\( I = \dfrac{S}{\sqrt{3}\,V_{LL}} = \dfrac{130/0.98 \times 10^6}{\sqrt{3} \times 230{,}000} \approx 333\ \text{A} \)
So you would connect this at transmission voltage and size the substation for about 133 MVA, typically with redundancy: two 150 MVA transformers in an N+1 arrangement, or three 75 MVA units. Here is the same arithmetic in a few lines of Python:
P_IT  = 100.0          # IT load, MW
PUE   = 1.3            # power usage effectiveness
LF    = 0.90           # load factor (a data center runs nearly flat)
pf    = 0.98           # power factor at the point of connection
V_LL  = 230e3          # connection voltage, V

P_fac = P_IT * PUE                    # facility load, MW
E_yr  = P_fac * 8760 * LF / 1e3       # annual energy, GWh
S     = P_fac / pf                    # apparent power, MVA
I     = S * 1e6 / (3 ** 0.5 * V_LL)   # line current, A

print(f"Facility load : {P_fac:.0f} MW")
print(f"Annual energy : {E_yr:,.0f} GWh")
print(f"Line current  : {I:.0f} A at 230 kV")
None of the individual steps are hard. What is hard is that the grid now has to find 130 MW of firm capacity, plus the transmission to deliver it, in the time it takes to build a warehouse full of servers.
The interconnection queue and 'bring your own power'
The binding constraint usually is not energy, it is speed. A large load still has to go through an interconnection study, and on a congested system that can take years. Developers building on AI timelines do not want to wait, so a whole set of workarounds has appeared.
The most common is co-location and behind-the-meter generation: pairing the campus with its own gas turbines, a power purchase agreement at an existing nuclear plant, or on-site generation that lets the site energize before the full grid upgrade is done. Some operators are signing deals for dedicated generation precisely because the public grid cannot connect them fast enough. This is the “bring your own power” era, and it raises hard questions about cost allocation, reliability, and who pays for the shared network upgrades.
It also flips the traditional planning order. For decades, generation chased load through a slow, studied process. Now load is chasing whatever generation and grid capacity it can find first.
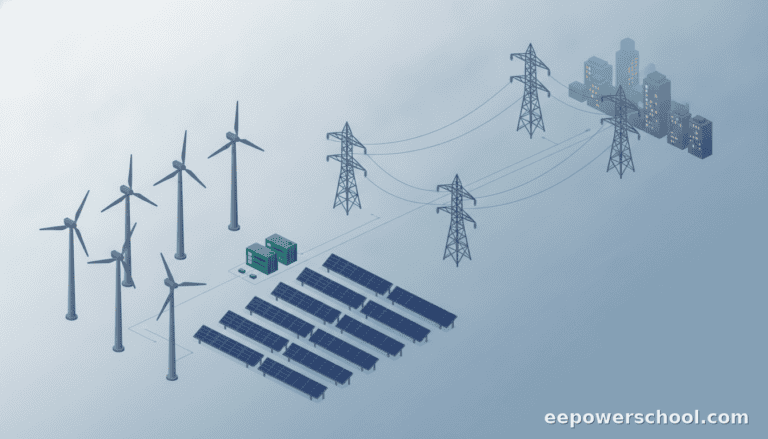
What data center load growth does to the bulk grid
Zoom out from one campus and three system-level pressures show up.
Resource adequacy. Adding tens of gigawatts of firm, flat load reverses a generation of flat-demand planning. NERC has flagged data centers as a top driver of rising shortfall risk, because this load needs firm capacity available in every hour, not just occasional peaks.
Transmission. The load is landing in clusters that local networks were never sized for, and new lines take the better part of a decade. That mismatch between a two-year data center and a ten-year transmission line is the core planning problem, and it ties directly into how we run the transmission planning process for high-renewable grids.
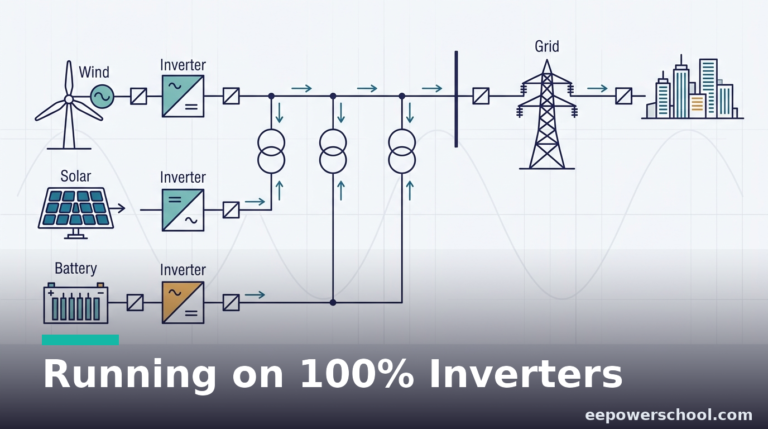
Operations. Fast, synchronized AI ramps add to the balancing burden at the same time the grid is leaning more on variable renewables and losing conventional inertia, a theme we cover in the post on high IBR penetration challenges. More variability on both the supply and demand side is a genuinely new operating regime.
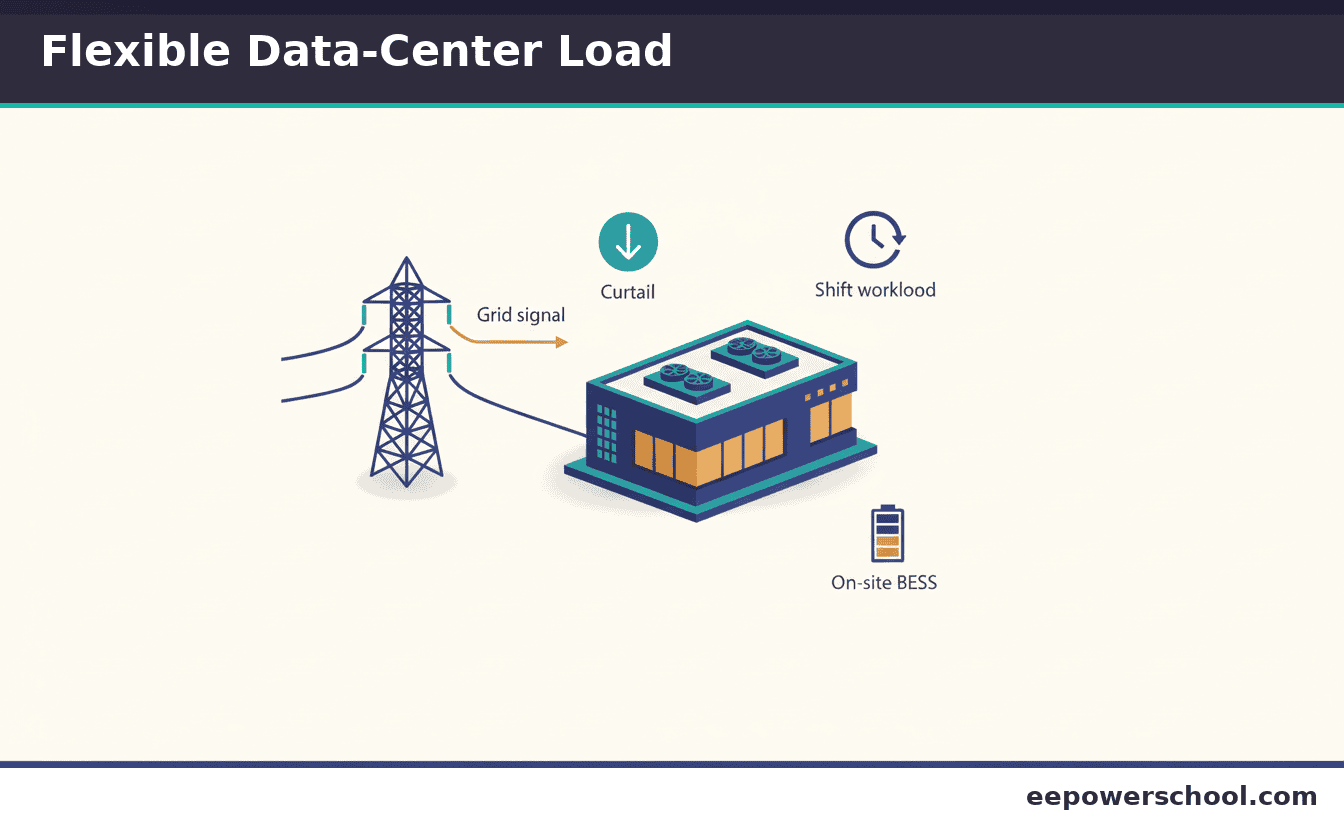
The real fix: turning data centers into flexible load
Here is the part that catches people by surprise. The cheapest way to absorb this load is not to build for its full peak, it is to make the load flexible for a small fraction of the time. Studies of large flexible loads have found that allowing a campus to curtail or shift for well under 1% of hours can unlock far more hosting capacity on the existing system than anyone expected, because the grid only has to cover the rare worst-case hours.
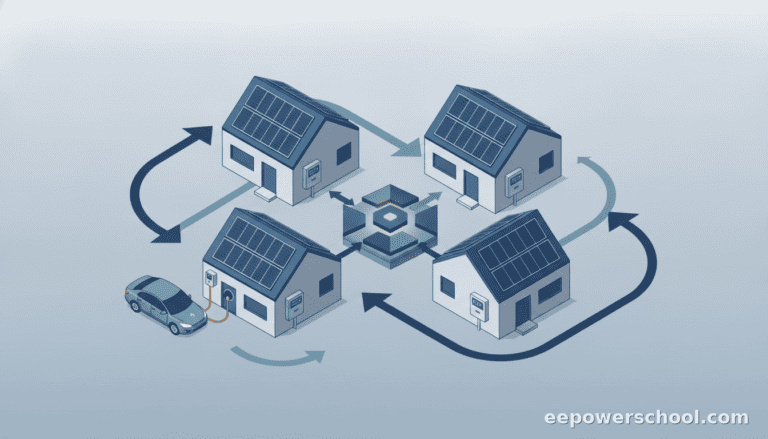
Flexibility comes in several forms. Temporal shifting defers non-urgent AI training to off-peak hours or to times of surplus renewables. Spatial shifting routes workloads to data centers in other regions that have headroom right now. On-site storage lets a campus ride through scarcity events and shave its own peak, using the same sizing logic in our guide on how to size a battery energy storage system. And straightforward demand response trims load on a grid signal during the handful of hours that actually matter. EPRI’s DCFlex initiative and a wave of utility pilots are now testing exactly these ideas at scale.
Treated this way, a data center stops being a problem the grid has to build around and becomes a resource that helps balance it.
What this means if you plan or operate the grid
If you work anywhere near system planning, a few practical habits follow from all this. Plan around the coincident peak and the high load factor, not a nameplate number, because a data center’s firm energy is what stresses both generation and the wires. Treat large-load interconnection with the same rigor as a generator study, including ramp behavior and fault contribution from the site’s power electronics. Push for flexibility in the interconnection agreement itself, since a contractual right to curtail for a small share of hours is worth more than another substation. And pair the connection with storage and a transmission plan from day one rather than bolting them on later.
The engineering here is not exotic. The challenge is doing it at a speed and scale the power industry has not had to match before.
Conclusion
Data center load growth is the first real test of a grid that spent a generation planning for flat demand. The numbers are large, the timelines are short, and the load is landing in concentrated pockets that local networks were never sized for. None of that is unsolvable, but it does mean planners have to move at a speed the industry is not used to.
If you take one idea from this, make it the flexibility point. The cheapest gigawatt is the one you never have to build, and a data center that can trim or shift its load for a small fraction of the year is worth far more to the grid than one that cannot. That is where both the engineering and the contracts are heading.
Key takeaways
- US data centers used about 4.4% of national electricity in 2023 (176 TWh) and could reach 6.7% to 12% by 2028, per the LBNL/DOE report.
- Globally, the IEA expects data center demand to more than double to about 945 TWh by 2030, with AI the main driver.
- A single 100 MW IT campus at PUE 1.3 draws about 130 MW and roughly 1.02 TWh per year, close to 100,000 US homes.
- Data centers run nearly flat (load factor around 0.9), so they add firm energy and firm peak, not just an occasional spike.
- The real bottleneck is interconnection speed, and modest flexibility unlocks far more grid headroom than building for the full peak.
Frequently Asked Questions
How much electricity do data centers use?
In the US they used about 4.4% of national electricity in 2023 and could reach 6.7% to 12% by 2028. Globally they were about 1.5% (415 TWh) in 2024, projected to roughly 945 TWh by 2030.
What is PUE?
Power Usage Effectiveness is the ratio of total facility energy to the IT energy alone. A modern hyperscale data center runs around 1.1 to 1.3, and lower is better because it means less overhead for cooling and power conversion.
Why is AI harder on the grid than older data centers?
AI training packs thousands of GPUs that draw large, synchronized, fast-changing power, and the campuses are far bigger. That stresses local capacity and grid balancing in ways ordinary, steadier loads do not.
Can the grid handle data center growth?
Yes, if the load becomes flexible and interconnection and transmission keep pace. The constraint is speed and local capacity, not the total amount of energy involved.
Related reading
- transmission planning for high-renewable grids
- high IBR penetration grid stability challenges
- how to size a battery energy storage system